In development you may encounter the error
Maximum call stack size exceeded. As the name suggests, it’s a stack overflow. But understanding just that is not enough, so here is a summary.
Stack
A stack is a data structure with LIFO (last in, first out). In JS, function calls can be nested (A calls B calls C). This involves managing multiple execution contexts, and JS engines use a stack.
Example:
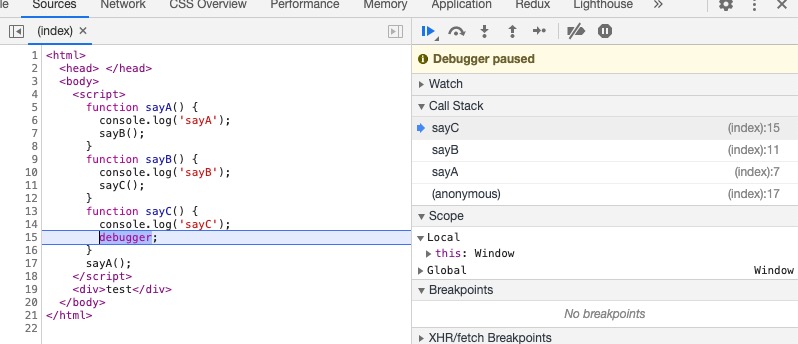
      function sayA() {
        console.log('sayA');
        sayB();
      }
      function sayB() {
        console.log('sayB');
        sayC();
      }
      function sayC() {
        console.log('sayC');
        debugger;
      }
      sayA();
When you break in Chrome DevTools, you can see the call stack. When C executes, it is on top, matching stack behavior.
Since it is a stack, what is the maximum depth? I tested it.
Max call stack depth
  function runStack(n) {
        if (n === 0) return 100;
        return runStack(n - 1);
      }
      runStack(20000);
The recursion above causes stack overflow in the browser, but adjusting n avoids errors. This can be used to approximate stack depth.
In
Chrome 88.0.4324.192, the stack depth is11383. 11384 triggers the error.Different browsers and versions have different depths.
Stack depth is not configurable.
The call stack has two metrics: maximum stack capacity and maximum call depth. If either is exceeded, you get overflow. I believe maximum stack capacity refers to memory used by contexts.
When a stack overflow occurs, the console points to the root error line. But sometimes performance issues occur before errors. How to find expensive functions quickly?
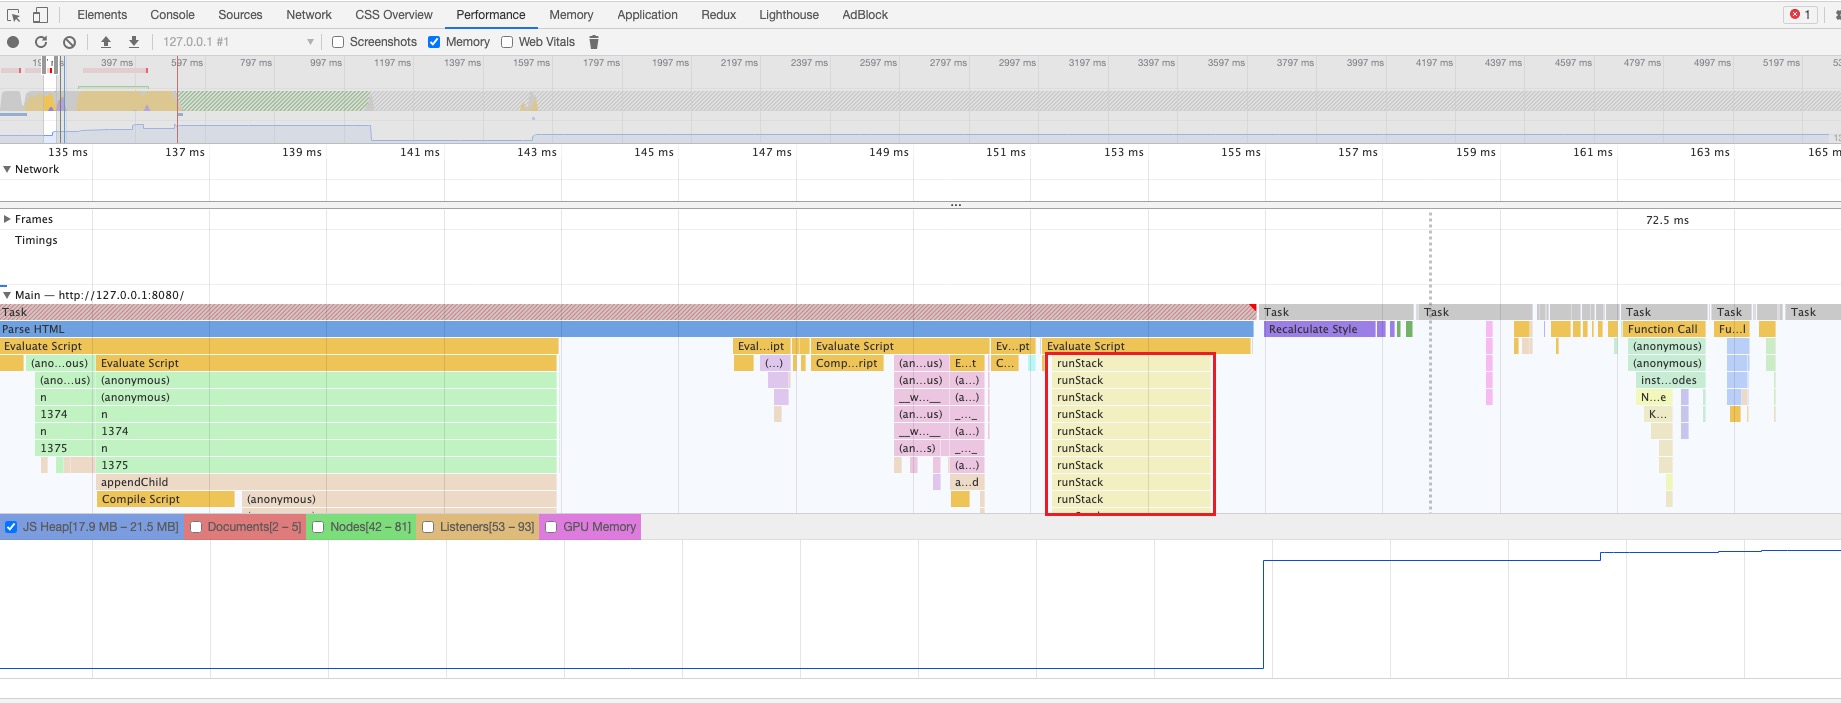
Chrome DevTools analysis
The Performance and Memory tools help analyze memory usage.
- Performance records memory usage over time.
- Memory can snapshot the call stack at a point.
Using runStack, Performance shows it executing until overflow.
To snapshot before overflow, I set a breakpoint at n=11383. You can see memory usage is high.
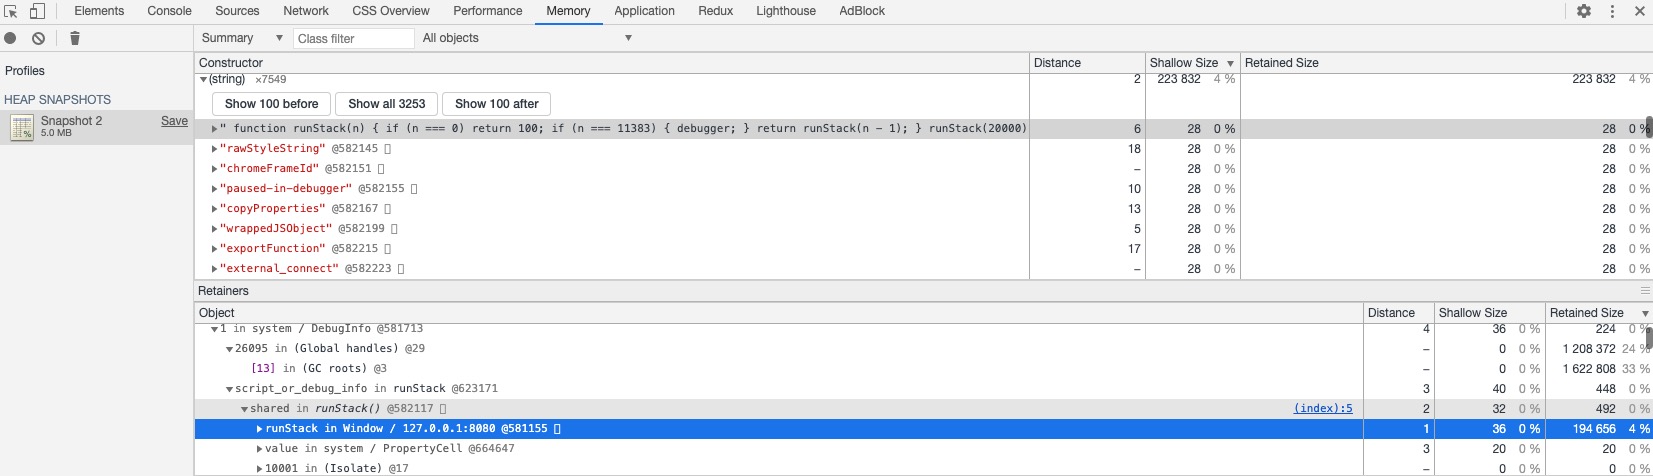
Note: size units are bytes.
Final Thoughts
Use Chrome DevTools well to better understand the web and troubleshoot efficiently.