We integrated NPS into our web product a while back, but I hadn’t studied it systematically. I read up on it and summarized here.
At the same time, I also used NPS to analyze the current product and clarify some of the deficiencies reflected by user feedback. I will work hard to improve it.
NPS
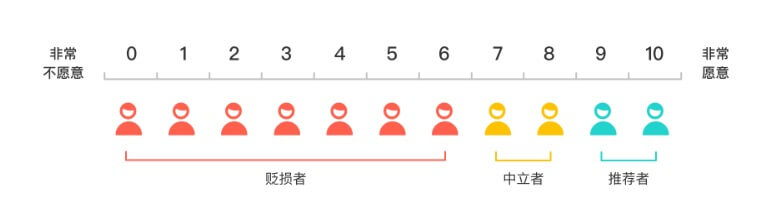
NPS stands for Net Promoter Score — a metric of how likely users are to recommend a brand/product/service.
Formula
NPS = (Promoters / Total) × 100% − (Detractors / Total) × 100%
Examples
If 100 users participate in the survey, 80 recommend and 20 detract, then the NPS value is
80% - 20% = 60%
If 100 users participate in the survey, 20 recommend and 80 detract, then the NPS value is
20% - 80% = -60%
If 100 users participate in the survey, 20 recommend, 40 detract, and 40 are neutral, then the NPS value is
20% - 40% = -20%
Notes
- Users give 0–10 ratings, but NPS ranges from −100% to +100%. Seeing 80 or 100 in charts is normal because it’s a percentage.
- The 9 vs. 10 distinction doesn’t matter to NPS — both are Promoters.
Our product right now
Our NPS hovers around 10 — positive, but with lots of room to improve. Only about 10% likelihood of recommendation.
Final Thoughts
NPS is useful to surface user feedback via surveys. Listen and fix issues; next goal: reach 40%.