Screen Time in Apple Systems

Mar 7, 2025 · 1 min read · 78 Words · -Views -Comments · Software & Tools
Apple Ecosystem IOS 🇨🇳 阅读中文版
Read with AI

Choose an AI assistant

ChatGPT Open in a new tab with the article link and prompt
Claude Copy the prompt, then open Claude

Open Claude
Trouble reading the article?

If the prompt is missing, copy the full prompt below into your AI assistant. If the AI cannot read the article, paste the visible passage you want to discuss and add your question.

Today a friend asked me what the gray bar chart in Apple’s Screen Time statistics means. I actually wasn’t too sure either, so I looked it up and here I’ll record what I found.

Gray Bar Chart
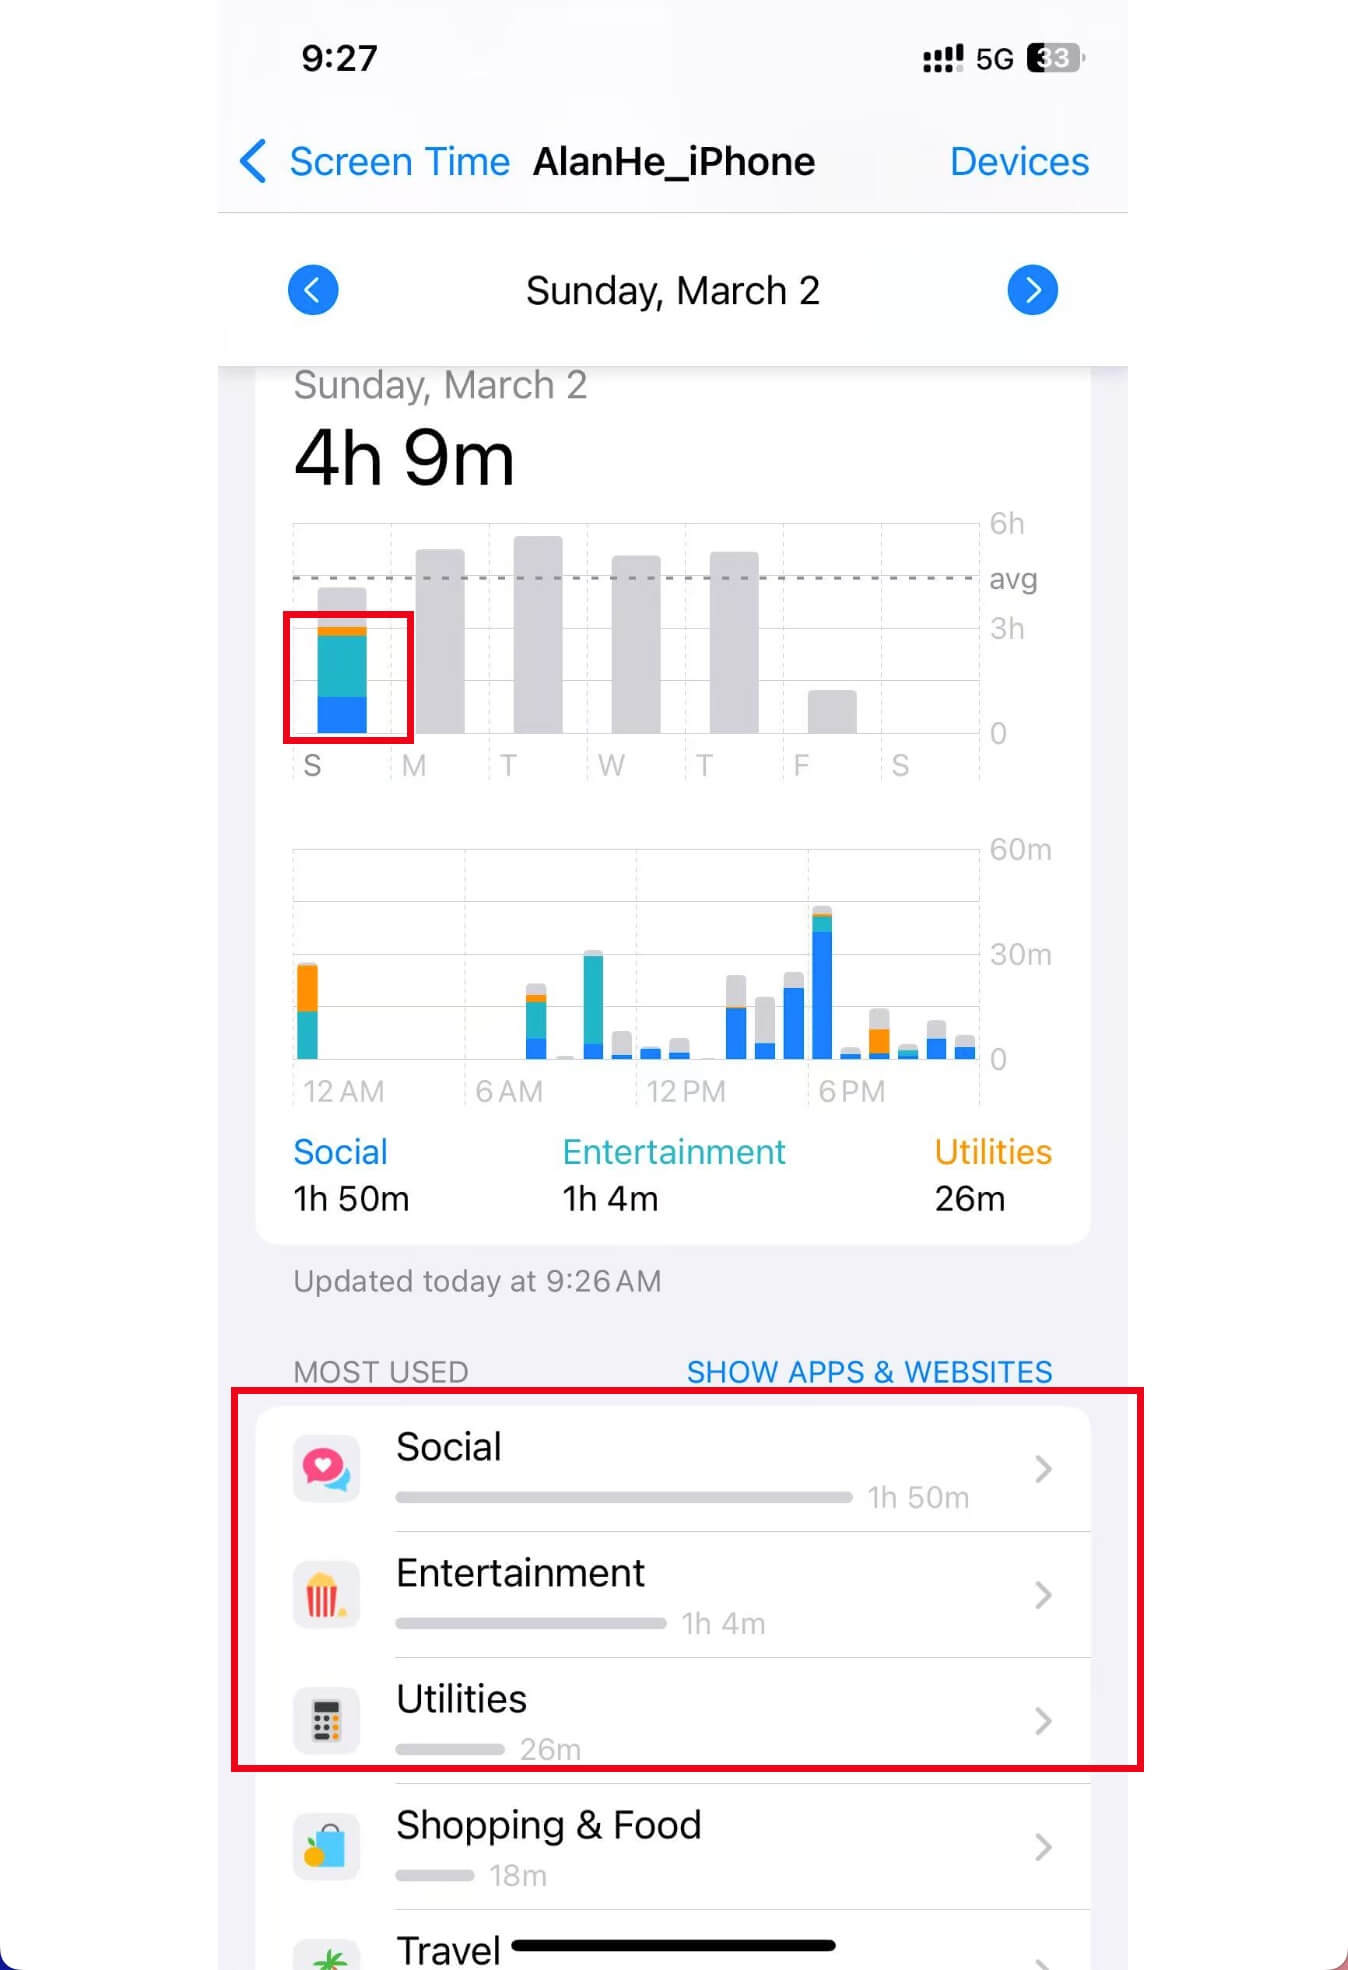
https://static.1991421.cn/2025/2025-03-07-115030.jpeg

After actual research and analysis, here’s my personal understanding. The gray bar chart represents the time you use apps, but this time is not your actual app usage time, but rather the time Apple estimates based on your app usage patterns.


Authors
Developer, digital product enthusiast, tinkerer, sharer, open source lover